Network Usage
Monitoring network usage is vital for ensuring the performance and efficiency of your cloud resources. This section provides guidance on how to access, interpret, and analyze network usage metrics.
Accessing Network Usage Metrics
To view network usage data for your cloud resources, follow these steps:
-
Navigate to the Monitoring Dashboard:
- Log in to your cloud platform.
- Go to the Monitoring section from the main menu.
- Select Network Usage from the list of available metrics.
-
Set the Time Range:
- Utilize the Range buttons (1h, 8h, 1d, 1w, 1m, 3m) to specify the time frame for your analysis.
- For a custom range, choose the desired From and To dates.
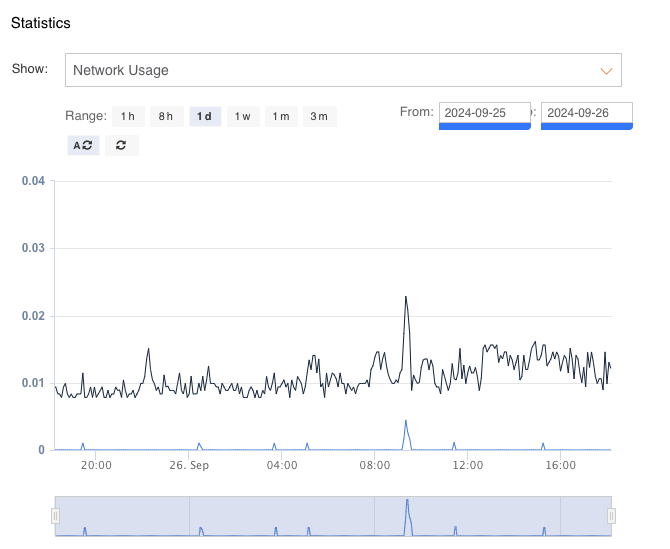
Understanding Network Usage Graph
The network usage graph visually represents the amount of data transmitted and received over the network during the selected time period.
- Y-axis: Indicates network usage in Mbit/s.
- X-axis: Displays the timeline of the selected range.
Interpreting the Graph
- Monitor the graph for trends and fluctuations in network usage to identify periods of increased activity.
- Significant spikes can indicate high traffic levels, which may affect performance.
Network Statistics Overview
In addition to the graphical representation, the statistics table provides detailed metrics on network usage:
| Metric | Minimum | Maximum | Average | 95th Percentile | Total GB |
|---|---|---|---|---|---|
| Network Transmit Total | 0.00 Mbit/s | 0.02 Mbit/s | 0.00 Mbit/s | 0.00 Mbit/s | 0.00 GB |
| Network Receive Total | 0.01 Mbit/s | 0.04 Mbit/s | 0.01 Mbit/s | 0.02 Mbit/s | 0.11 GB |
| NIC Transmit | 0.00 Mbit/s | 0.02 Mbit/s | 0.00 Mbit/s | 0.00 Mbit/s | 0.00 GB |
| NIC Receive | 0.01 Mbit/s | 0.04 Mbit/s | 0.01 Mbit/s | 0.02 Mbit/s | 0.11 GB |
| NIC Total | 0.01 Mbit/s | 0.05 Mbit/s | 0.01 Mbit/s | 0.02 Mbit/s | 0.11 GB |
| WAN Transmit | 0.00 Mbit/s | 0.02 Mbit/s | 0.00 Mbit/s | 0.00 Mbit/s | 0.00 GB |
| WAN Receive | 0.01 Mbit/s | 0.04 Mbit/s | 0.01 Mbit/s | 0.02 Mbit/s | 0.11 GB |
| LAN Transmit | 0.00 Mbit/s | 0.00 Mbit/s | 0.00 Mbit/s | 0.00 Mbit/s | 0.00 GB |
| LAN Receive | 0.00 Mbit/s | 0.00 Mbit/s | 0.00 Mbit/s | 0.00 Mbit/s | 0.00 GB |
Note: Statistics data is based on 1-minute average aggregated samples.
Analyzing Network Performance
- Minimum: The lowest recorded network usage during the specified period.
- Maximum: The highest recorded network usage, indicating peak activity.
- Average: The mean network usage across all recorded samples during the selected timeframe.
Best Practices for Monitoring Network Usage
- Regular Reviews: Frequently check network usage trends to proactively manage bandwidth and prevent bottlenecks.
- Investigate Spikes: Look into any significant increases in network usage to identify potential issues or high-demand applications.
- Resource Allocation: Adjust network configurations or bandwidth allocation based on observed traffic patterns to optimize performance.